Waste data can be difficult to grasp even for the most well-versed experts in the subject. As the largest awareness campaign about waste prevention in Europe, the European Week for Waste Reduction (EWWR) often works with the ambiguity and misconceptions surrounding waste statistics. In order to dispel some of the myths, we have devised a list of five facts about waste in the European Union (EU) that might surprise you.
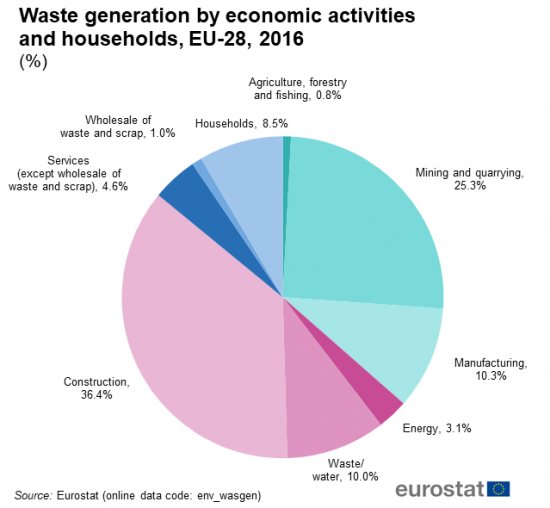
- Households are responsible for a relatively small proportion of the total amount of waste generated in the EU. Yes, you read correctly. According to Eurostat, the institution that compiles data about waste in the EU, households accounted for a mere 8.5% of the 2.5 billion tonnes of waste generated in the bloc in 2016. Meanwhile, the construction sector and mining and quarrying were responsible for more than 61% of the total waste. That means that excavated soil, demolition waste, concrete, bricks, aggregates, and other similar materials account for the majority of the waste in the EU.
- But that is because our measurements are skewed. Weight is how we normally quantify waste at the moment, but it is a poor metric to use. One tonne of sand from a demolition site may sound like a lot of waste, but its environmental impact is not that great. After all, it can be easily used somewhere else. The main environmental impact, in its case, would come from transporting the sand from one site to another. Meanwhile, wasting one tonne of beef would result in CO2 emissions equivalent to those emitted by an average car in 15 years. That is to say nothing of the water used by the cows that were the source of the beef and the land necessary for the pastures on which they ate.Even when looking at more similar types of waste—like different types of food waste, for instance—the impact on the environment and the climate can vary widely if weight is the working metric. For instance, a study of six supermarkets in Sweden between 2010 and 2012 revealed that, although meat accounted for only 3.5% of the total waste by weight, it represented 29% of the total CO2 emissions associated with food waste. To make a long story short, weight is not a good measurement for estimating the harm that waste does to the environment and its contribution to climate change. And yet it is the most commonly used metric in waste management because it is the easiest to measure, track, and report.
- You wouldn’t guess who some of the largest wasters in the EU are. Northern European countries have a reputation for being progressive and sustainable. But did you know that they are also among the leading waste producers in the EU? Danes topped the charts in 2016, producing 777 kg of municipal solid waste per person. That was a whooping 60% more than the EU average.
- Not all waste treatment methods are equal. Waste statistics can be deceiving. Did you know that as much as half the waste from Swedish households is burned in incineration plants? While burning waste is evidently better than landfilling it, the reality is that incineration is a source of pollution and carbon emissions, which contribute to climate change. Yet, it is hard to glean such details from waste statistics. Officially, waste-to-energy (the technical term for burning waste and capturing the energy from that process) counts as recycling. And officially, Sweden recycles 99% of its waste.
- Prevention is key. To make a long story short, waste statistics should be taken with a pinch of salt. The reality is that we do not fully understand the harm our waste is doing to the planet and to the climate because we do not have good ways to measure its impact. That is why our motto at the EWWR is that “the best waste is the one that is not produced”.
 EN (full site)
 ITA
ITA FRA
FRA POR
POR ESP
ESP CAT
CAT DEU
DEU NED
NED HUN
HUN